E-mail to SMS events
This guide gives you information on how to view the event log of e-mail to SMS connection. It is a crucial function of the Ozeki SMS Gateway. This way you can monitor everything happening on your network and have faster fail recognizing. The guide focuses on the built in SMTP/POP3 client of Ozeki 10 SMS gateway. It shows you how you can open the "Powers" tab, and how you can enable the event viewer functionality. The steps are relatively simple. The setup should not take more than 3 minutes.
How to send SMS from POP3 / IMAP (Easy commands)
To send SMS from POP3 / IMAP:
- Launch Ozeki SMS Gateway
- Select POP3 client
- Go on the Powers tab page
- Create new power
- Choose Events
- Name the power
- Open Events tab page
- Check the logs
Step 1 - Open the e-mail to SMS connection
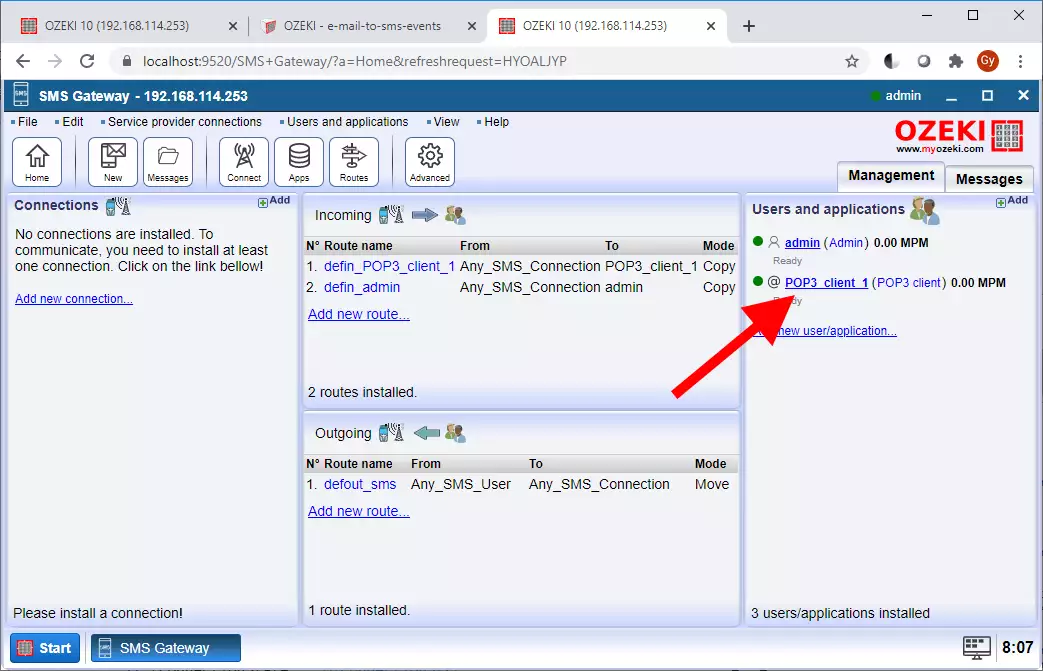
To get the events tab of a connection, first on the “Users and Application” panel, please find the connection you want to know more about. Here on Figure 1, we used a sample POP3 connection. You can get to the main menu of the connection by clicking the connection name which is written in blue.
Step 2 - Select the powers tab of the e-mail connection
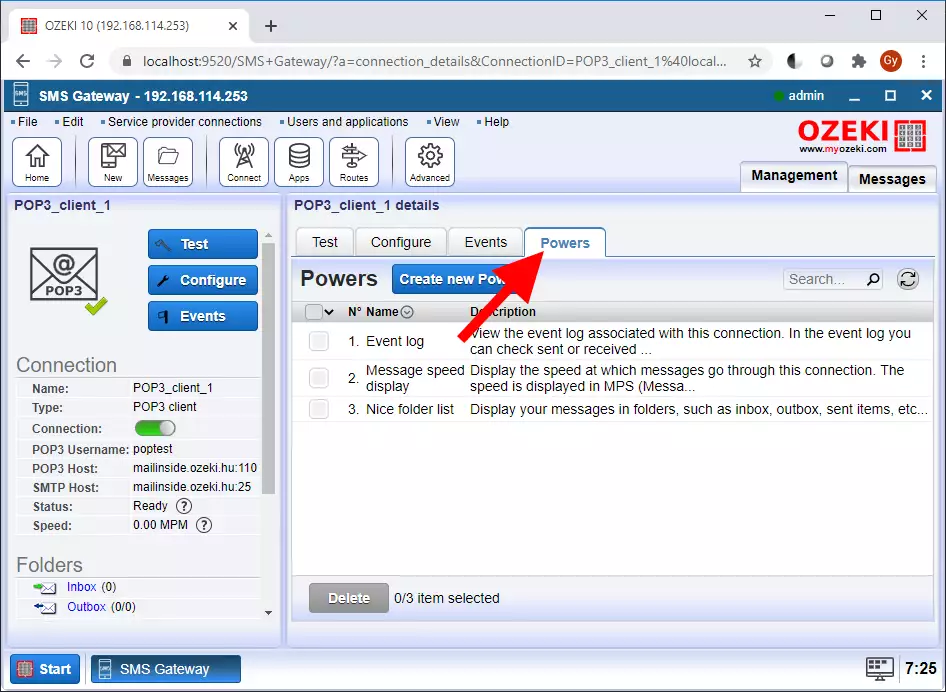
Next up, you must get to the powers tab. It is located under the connection’s name. Here you will see the powers you can set for your connection. These are different settings which you can configure the way you want. You can find the button with the help of Figure 2.
Step 3 - Click on create new power
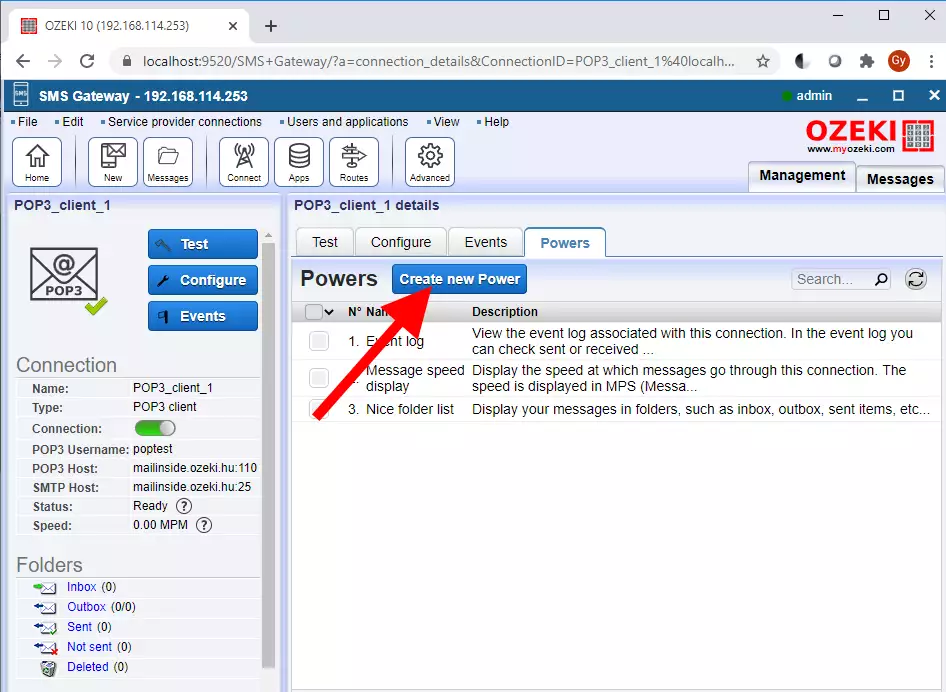
Now you can make a new power on your connection. To proceed, please click on the “Create new Power” button, which will take you to the power details panel. The button is located next to the “Powers” title. You can find it with the help of Figure 3.
Step 4 - Select events
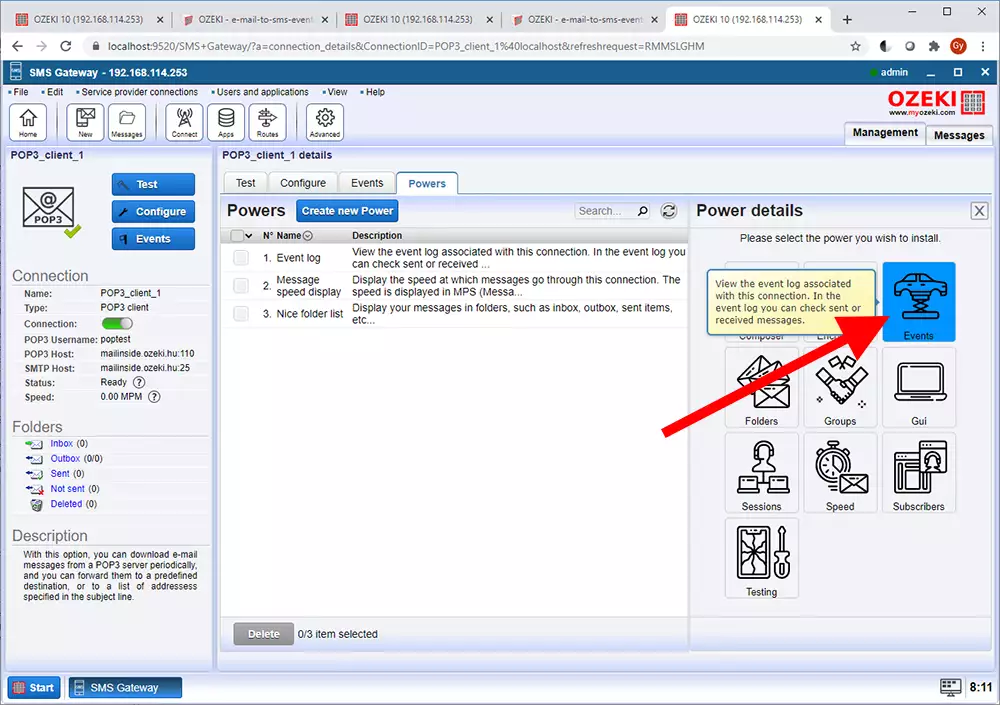
You can see on Figure 4, the different powers you can choose for the connection. You can install any of them by clicking on the icon. To monitor your network in real time, you need to choose “Events”. To proceed with the installation of the power, please click the “Events” button. This will start opening your event log.
Step 5 - Approve your selection
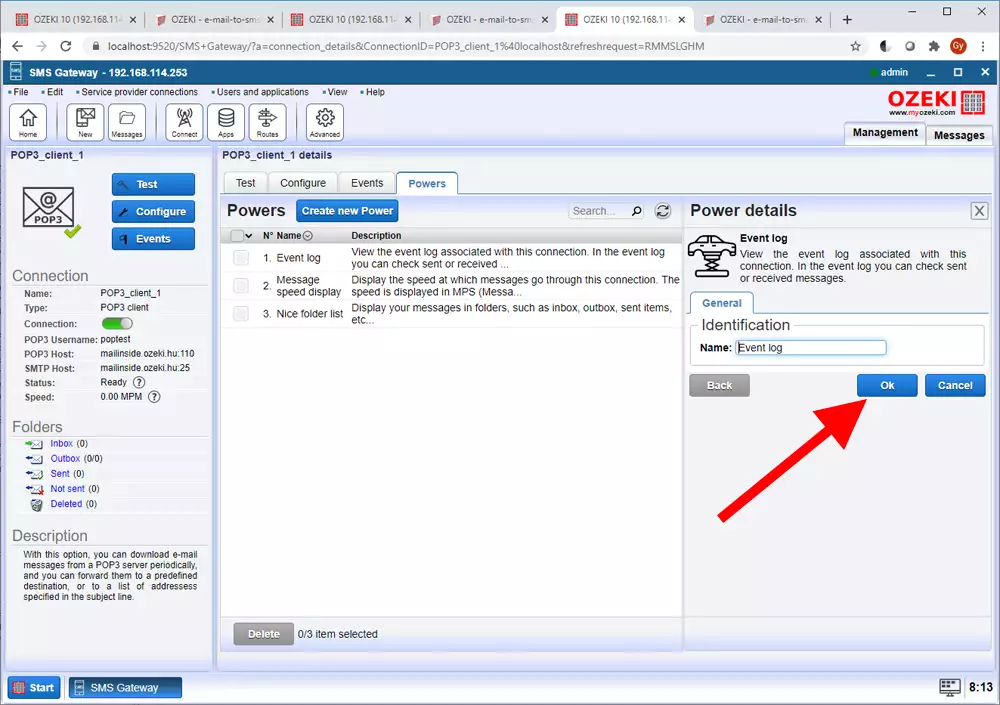
On this panel you can identify your new power by giving it a unique name. Just type in the filed named “Name”. Click “Ok” to proceed to the final step. You can easily find the button with “Figure 5”.
Step 6 - View the event log
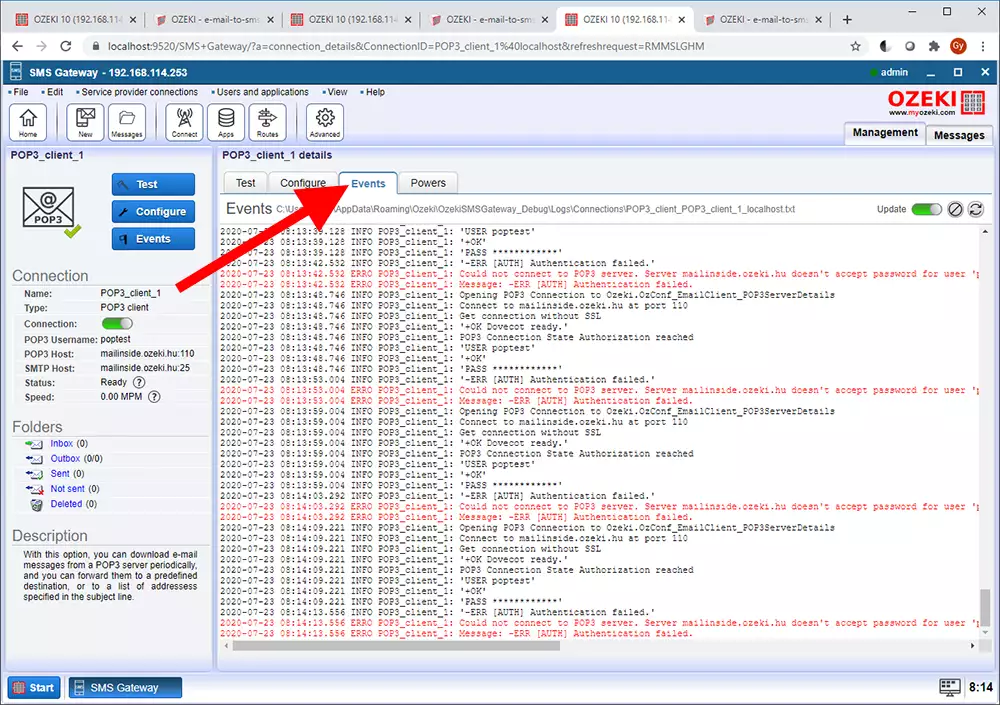
Now you can monitor your connection and see the results on the “Events” window. You will se everything happening on your network. If the line is red, it means something is happening out of the order. Usually it means something has failed in the system. You can watch your example Events window on “Figure 6”.
More information
- How to send SMS as E-mail through Gmail
- How to send SMS from POP3 / IMAP
- How to send SMPP SMS to E-mail

 Sign in