
 Sign in
 How to view SMS reports on a Bar chart
This page shows you the steps on how to view information in the reporting database as Bar-charts or pie charts. The "Chart reporting" feature is Ozeki SMS gateway will work on databases where the default message report database structure is used.
What are SMS reports?
SMS reports are summaries of your text message activities. They give you information like how many messages were sent, delivered, or had issues. These reports are handy for figuring out how well your texting is going and if there are any problems to fix. They help you improve your communication strategies.
How to view SMS reports on a Bar chart (Quick Steps)
- Log into Ozeki SMS Gateway
- Click on the 'Edit' menu item
- Within 'Edit' open the 'Reporting' menu
- Click on 'Create new SMS Reporter' and then on 'Display'
- Send SMS text to generate data
- Click on 'Charts'
- Select 'Message count (Bar) report
- Select 'Delivery success (Pie)' report to view data as a diagram
- Select 'Message Count (Table)' report to view data as a table
- Switch back to the bar chart
How to view SMS reports on a Bar chart (Screenshots)
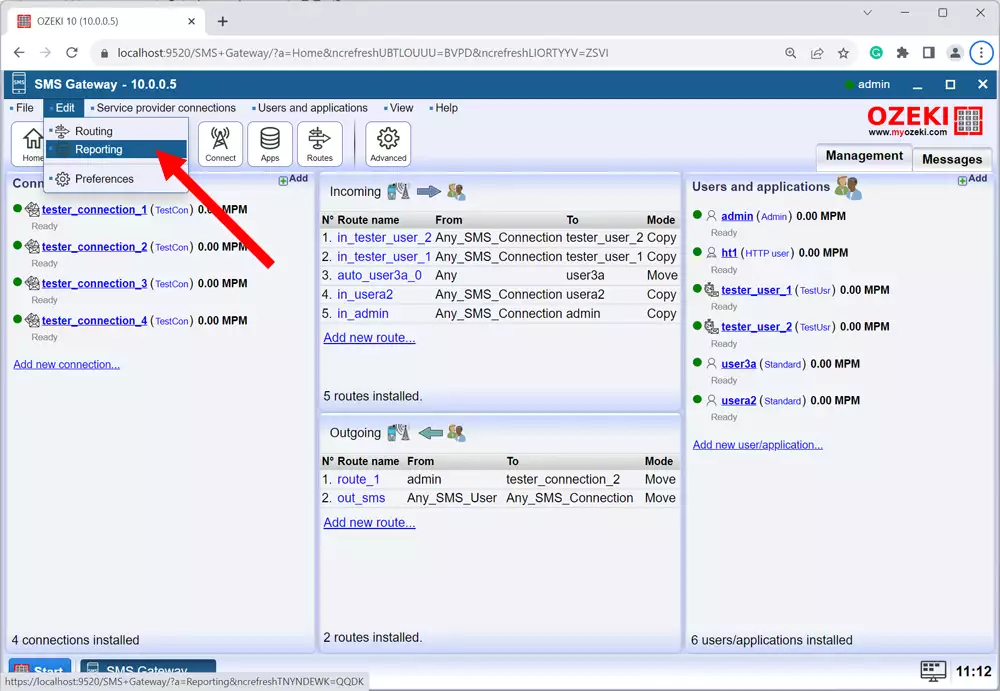
The first step you need to take is to log into Ozeki SMS Gateway. If you do not have the software yet, download the Ozeki SMS Software from the SMS product website. Once you are inside, click on the 'Edit' menu item, shown in Figure 1 and then open the 'Reporting' menu.
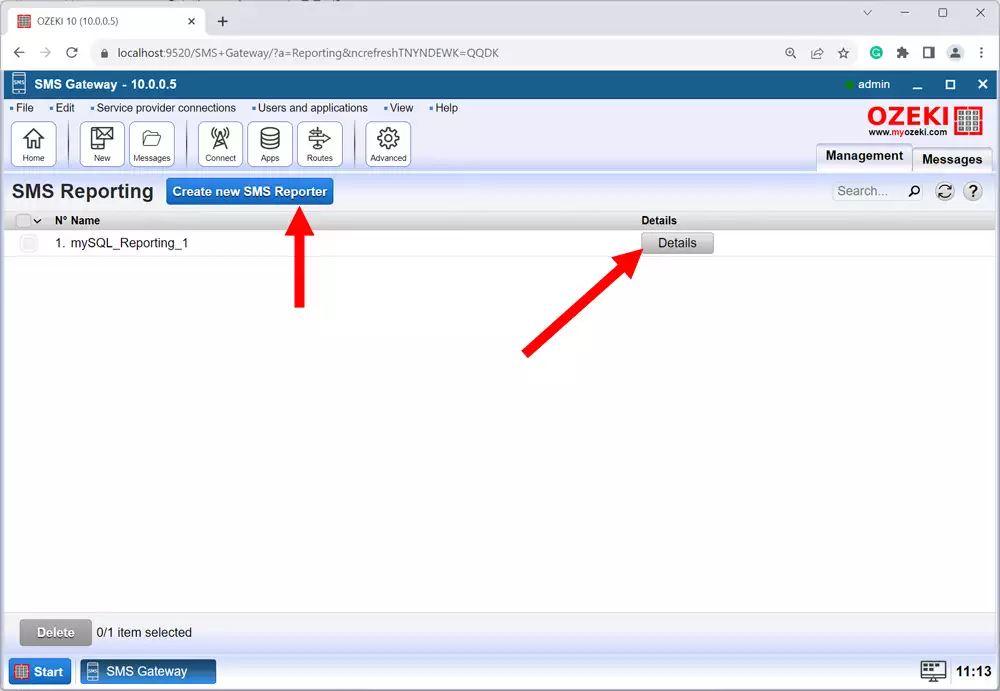
The next step is setting up a database reporter. This can be done, if you click on the 'Create new SMS Reporter' tab and then you have to click on 'Details' as you can see in Figure 2.
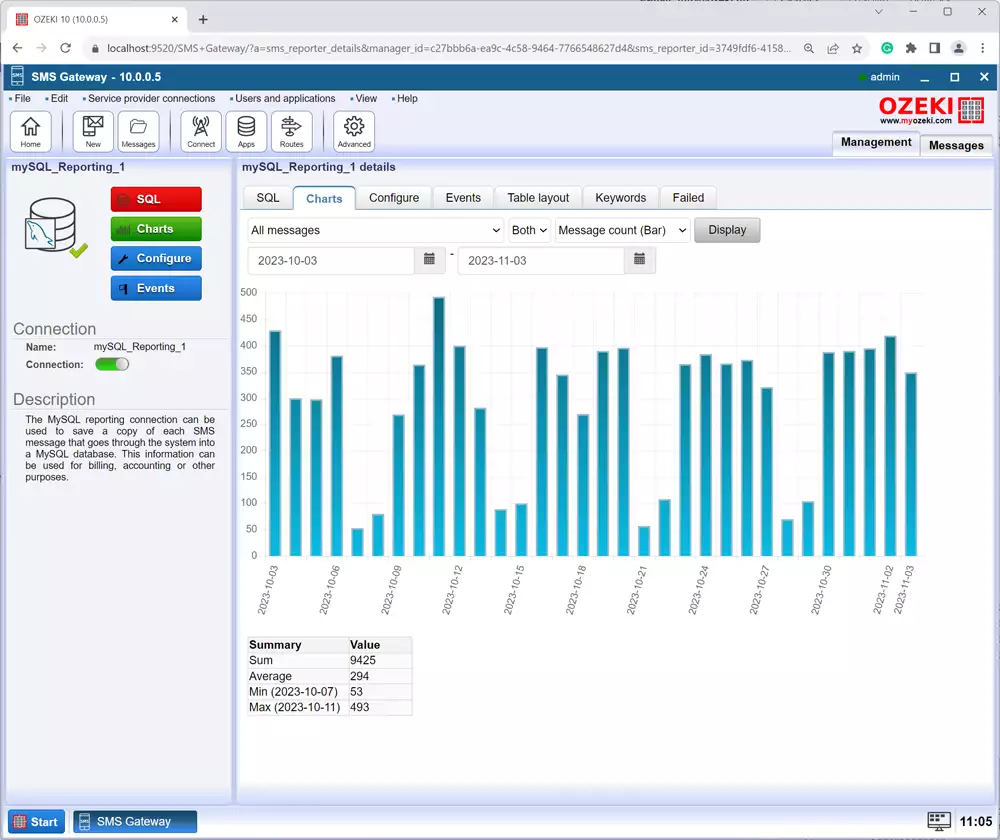
If you are done with the previous steps, you can move along to the next one. You have to send some SMS messages to generate data like we did in Figure 3. Once you are done with that, click on 'Charts' from the left panel, then select 'Message count (Bar)' report and then click on 'Display' so you can view reports about your SMS history on a bar chart.
![]()
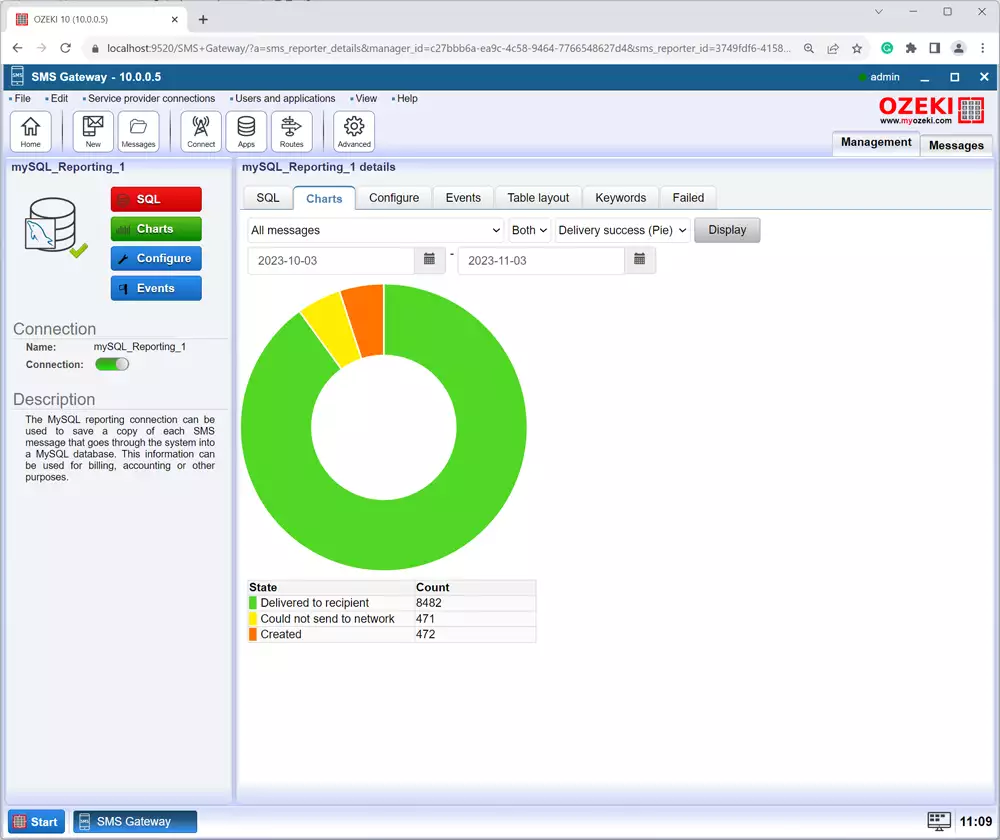
Select the 'Delivery success (Pie)' report and then click on 'Display' as we represented in Figure 4. You will see a pie diagram generated by the available data. Each colour of the diagram represents a different state of the SMS text, and you can also view the quantity of SMS messages related to each state.
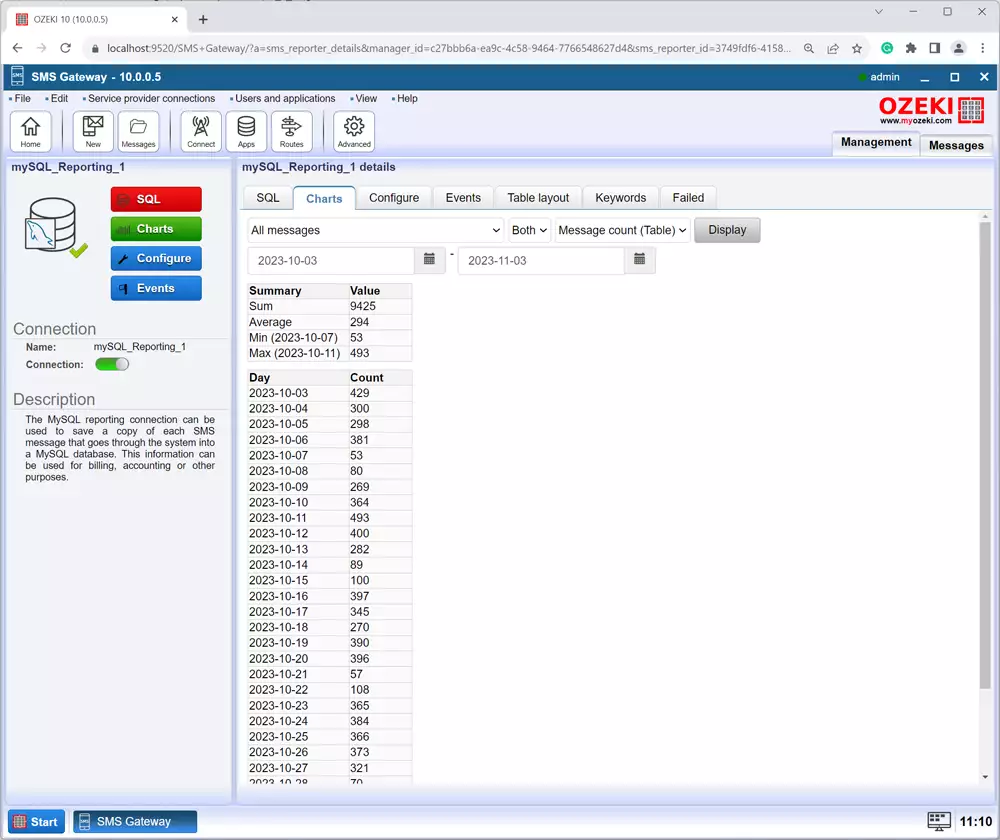
You can also view the data as a table. To manage this, you need to select the 'Message Count (Table) report and then click on 'Display' just like in Figure 5. By viewing all data as a table you can get a better understanding of your data, as it provides a more organised structure.
Switch back to the bar chart as shown in Figure 6 to get a clear look at them. To do this select the 'Message count (Bar)' report and click on 'Display'.
Frequently Asked Questions (FAQs)
When should I use a bar chart in SMS promotion?
Use a bar chart in SMS promotion when you want to compare SMS data, like message counts or stages related to SMS texts for example, SMS texts that were delivered successfully, SMS texts that were not delivered successfully, and SMS texts that were created. It is great for showing clear differences in size or quantity. Using a bar chart in SMS promotion is a very important part of creating a successful SMS campaign. If you have straightforward data that you want to represent visually, a bar chart is a simple and effective choice as it is a clear and widely accepted way to showcase your information. The simplicity of a bar chart makes it easier to optimize different aspects of your SMS campaign thus enhancing the success of your SMS promotion efforts.
You can view for example:
- The total number of SMS messages
- The messages that were successfully delivered to recipients
- The percentage that were failed to be delivered
What are SMS Performance Monitoring reports?
SMS Performance Monitoring reports are summaries that show how well your SMS text messaging is working. They include important details like delivery rates, success rates, and any issues with sending messages. These reports help you keep an eye on the performance of your SMS system, making sure it runs smoothly and effectively for your communication needs.
Who can access SMS performance monitoring reports?
People who manage the SMS systems, like IT teams and customer support, access SMS Performance Monitoring reports. These reports help them check how well the SMS is working and make sure it is effective for different tasks, from technical aspects to marketing campaigns and customer communication.
What are SMS campaign reports?
SMS campaign reports give you details about how well your text message marketing is doing. They show things like how many messages were sent, delivered, and if there were any issues. These reports help marketers understand the success of their SMS campaigns, make better decisions, and improve future messaging strategies.
What are the benefits of viewing SMS reports on a Bar chart?
Viewing SMS reports on a bar chart is beneficial because it makes it easy to compare message counts, delivery success, and other SMS stats. The visual presentation helps quickly spot trends and differences, making it simple for everyone to understand and make informed decisions about messaging performance.
Summary
This guide provides step-by-step instructions on how to view SMS reports on a Bar chart using the Ozeki SMS Gateway. By following the given instructions you can easily view your SMS-related information in the reporting database as Bar-charts or pie charts and enjoy its convenience. This process can benefit you as using bar charts is simple and easy to understand. They are also great for comparing different categories or states. Do not hesitate to make this aspect of your life easier, use Ozeki SMS Gateway and enjoy the facilities we offer.
More information
- How to save all SMS message into a CSV file
- High performance SQL reporting
- How to find out which SQL queries were not executed
- How to save the PDU count of Multipart SMS into a database
- High performance database reporting settings for MS SQL
- SMS report bar chart
- Powershell script to load SQL into mySQL